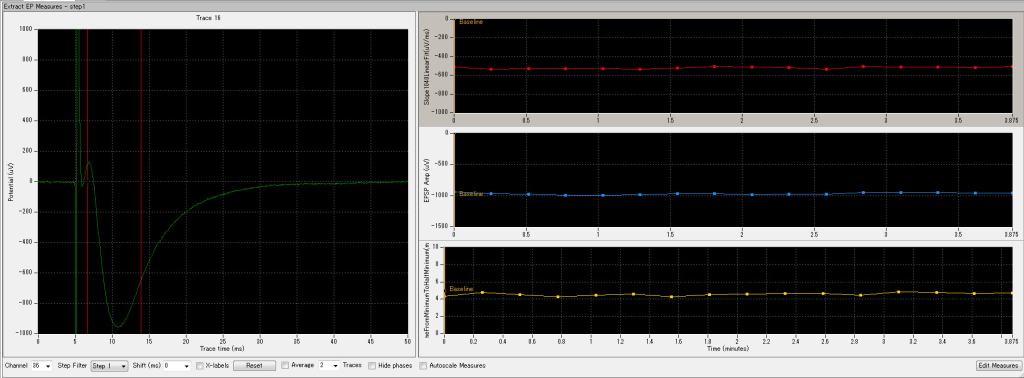
EP Package (Evoked Potential Measurement Package)
For recording and analysis of fEPSPs / LTP / LTD
Features
- Extractions of evoked local field potentials (e.g. fEPSPs).
- A broad set of waveform analysis (e.g. amplitude, slope, area, time).
- Cumulative plots for the analysis during (and post)-acquisition.
- Easy-to-set acquisition and stimulation parameters.
- Capability to design and apply complex stimulation sequences (e.g. thetaburst).
- Export raw data in binary or ASCII text file (csv).
- Export extracted waveforms and all analysis results as ASCII text files.
Examples for the Waveform Analysis
- Amplitude (Minimum, Maximum, Peak to Peak)
- Slope (10-40%, 10-90%, Liner fit)
- Absolute Area
- Pop Spike Area
- Time of Amplitude Minimum (Maximum)
- Time from Minimum/Maximum to Half Minimum/Maximum
- And More

Paired Pulse Analysis
[Left] extracted evoked signal. [Right] The top charts (red) show the time course of measured minimum amplitude for the first (left) and second (right) pulse . The bottom charts (blue) show the paired pulse ratio for the Amplitude Minimum. The left chart shows the percent change in the first pulse compared to the second pulse while the right chart shows the percent in the second pulse compared to the first pulse.

